Query object
Query object is basically tab with only one result table displayed.
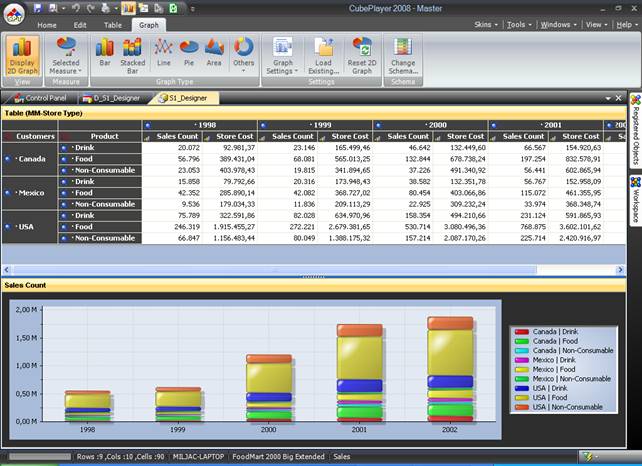
You can see your results as:
· Table
· Table and graph (synchronized)
Use icons:
· To add synchronized Graph view:
|
Icon |
Name |
Description |
|
|
Graph |
Displays
available graph settings |

· To change Graph types, displayed measures or to use additional graph features:
|
Icon |
Name |
Description |
|
|
Display
Graph |
Graph
on/off |
|
|
Bar |
Select bar
graph type |
|
|
Stacked
bar |
Select
stacked bar graph type |
|
|
Line |
Select line
graph type |
|
|
Pie |
Select pie
graph type |
|
|
Area |
Select area
graph type |
|
|
Others |
Select
radar or polar type |
|
|
Graph
Settings |
Upper part
of button to load settings form |
|
|
Graph
Settings |
Lower part
of the button to select graph settings like labels, grids
… |
|
|
Selected
Measure |
Select
measure or all measures you want to see |
|
|
Measure
pair Trend |
Activates
dialog to set trend, average, maximum or minimum lines and as well to
activate two-measures view |
|
|
Load
existing |
Load
existing graph settings and apply them to the
graph |
|
|
Reset 2D
Graph |
Resets 2D
graph |
|
|
Change
Schema |
Select and
apply new graph schema |


· To use special features
|
Icon |
Name |
Description |
|
|
Exceptions |
Displays
Exception form |
|
|
Subtotals |
Displays
subtotal form |
|
|
Add
dimension |
Adds
dimensions in rows, columns or filter axis |
|
|
Remove |
Remove data
from the table |
|
|
Swap
axis |
Swaps
axes |
|
|
Organize
members |
To organize
members at the table |
|
|
Swap
axis |
Swaps
axes |
|
|
ShowMe |
To activate
Show Me analysis |
|
|
HowMany |
To activate
How Many analysis |
|
|
Row |
To apply
MDX functions on dimension or entire axis
(row) |
|
|
Column |
To apply
MDX functions on dimension or entire axis
(column) |
|
|
Enumerate
row axis |
To
enumerate row axis |
|
|
Enumerate
column axis |
To
enumerate column axis |
|
|
Enumerate
both axes |
To
enumerate column and row axes |
|
|
Enumerate
both axes |
To
enumerate column and row axes |
|
|
Extended
table settings |
To define
different settings specific for this result table like: column width, row
colors, column colors, permissions |
|
|
Font
size |
Change font
size of actual result table |
|
|
Add to
DDG |
Group of
commands that allow adding to the Dynamic document generator
|
|
|
Add win to
DDG |
Adds active
tab |
|
|
Add panel
to DDG |
Adds active
panel |
|
|
Add Doc to
DDG |
Adds entire
Dashboard, Document, Layout |
|
|
Add Panels
to DDG |
Adds panels
as separate objects |
|
|
Add to
SRG |
Group of
commands that allow adding to the Static report generator |
|
|
Add win to
SRG |
Adds active
tab |
|
|
Add panel
to SRG |
Adds active
panel |
|
|
Add Doc to
SRG |
Adds entire
Dashboard, Document, Layout |
|
|
Add Panels
to SRG |
Adds panels
as separate objects |


To perform other actions inside panel like
· Drill-up
· Drill-down
· Remove member
· Isolate member
· Add-Remove members
· Add-Remove dimensions
· Add-Remove Filter
· Add Calculate measure
right click your mouse on the table or graph.
Each menu you will get is case sensitive.
Therefore different menus are available if you click on rows or columns.
Those menus depend of the display view as well.
 Delete all queries from folder
Delete all not opened queries from folder
Adding parameters to the query
Add dashboard to static reports
generator
Add dashboard panel to
dynamic documents generator
Add dashboard panel to static reports
generator
Collect objects for dynamic document
Save content of dynamic document generator
Collect objects for static report